Status page
On this page you can see general information about the device and ongoing calls.
Status
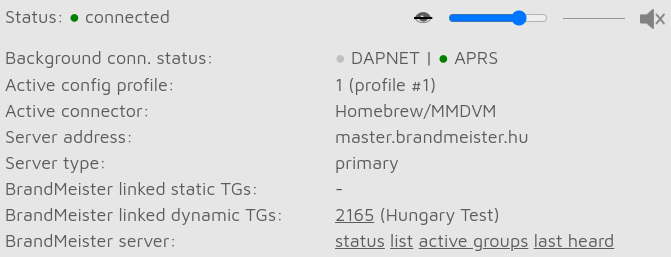
The status section shows the device status including the currently active configuration profile name and number, currently active connector and its configured server. Circle indicators of background connectors are green if they are connected to their configured servers.
Some connectors display additional information here like the list of linked talkgroups.
Note
The list of linked BrandMeister Network talkgroups are queried from the BrandMeister Network’s API server by the web browser and may not always be accurate.
Call log

The call log displays all incoming, outgoing and voice announcement calls. In modes where IDs are used as destination and source identifiers (ex. DMR, NXDN®) the IDs are matched to the ID database and replaced with callsigns.
Each call log entry has information about the call at the top right corner. BER is displayed in percent after the letter B, packet loss (in case of network calls) is displayed in percent after the letter L. The call duration is also displayed after a call ends.
You can export all call log entries in CSV format by clicking on the Export call log button.
If Advanced mode is enabled, then the Limit call log lines checkbox is shown. If it is checked (it’s checked by default) then only a limited number of call log entries are allowed to be in the call log. This is good for limiting the web browser’s CPU and memory use.
Live display view
You can open and close the live display view by clicking on the eye button left to the call audio volume slider:

The live display view shows the contents of the device display in real time.
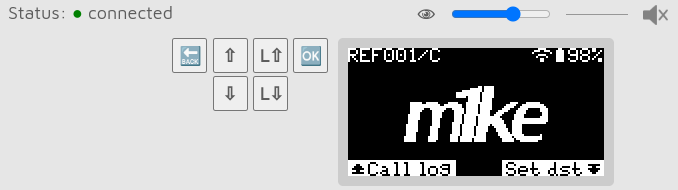
Use the buttons left to the live display view to remote control the device. The up and down buttons marked with letter L are for long press up and down.
You can also use the following keyboard shortcuts:
Ctrl+I - Toggle live display view
Ctrl+Left - Back button
Ctrl+Up - Up button
Ctrl+Shift+Up - Up button (long press)
Ctrl+Down - Down button
Ctrl+Shift+Down - Down button (long press)
Ctrl+Right - OK/Menu button
Important
Smooth live display view requires a Wi-Fi® connection with a good signal quality. If you have issues with the live display view, then please try using different browsers and make sure they are updated to the latest version.
Call audio
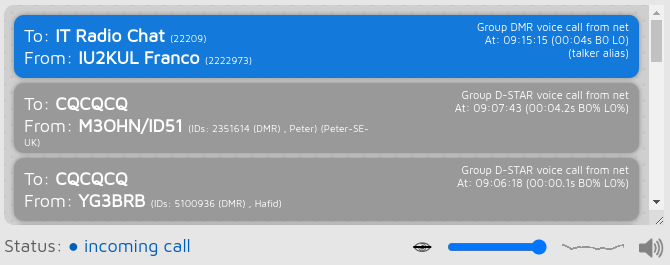
You can toggle call audio playback by clicking on the speaker icon under the call log, or with the keyboard shortcut Ctrl+M.
There’s a small oscilloscope view which shows call audio being played. Note that the oscilloscope view’s signal levels does not actually represent the volume of the played back audio, as the web interface uses audio dynamic range compression.
You can change the audio volume with the slider, or with the keyboard shortcuts Ctrl+V and Ctrl+B.
Important
Smooth call audio playback requires a Wi-Fi® connection with a good signal quality. If you have issues with call audio playback, then please try using different browsers and make sure they are updated to the latest version.
Note
Browsers reduce CPU allowance on non-active tabs after a while. The tab of the web interface must be kept active, otherwise the audio will be garbled. This browser behavior cannot be changed. If the audio becomes garbled, activate the tab, and/or reload the web interface to fix it.
Note
C4FM VW mode call audio playback is not supported.
Console

Note
This section is only shown if Advanced mode is enabled.
You can see all device log messages here. You can also send console commands to the device by typing them into the text input field and pressing the Enter key (or clicking on the Send command button). Enter help or h to see the list of available commands. You can turn on the device log by entering the log command.
If Limit lines is checked (it’s checked by default) then only a limited number of log lines are allowed to be in the log. This is good for limiting the web browser’s CPU and memory use.
You can export the log lines to a .txt file by clicking on the Export button.
Note
Log lines are only added to the console while it is visible. Use the USB serial console for full log access.
M1KE info
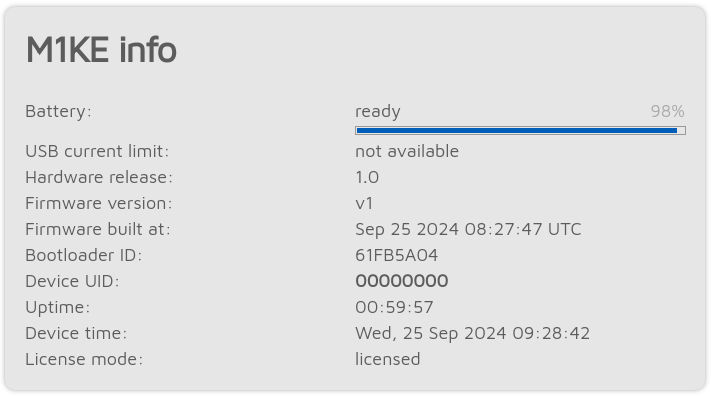
Here you can see basic information about the device.
USB current limit shows the used USB port current limit based on the connected port’s detected capabilities.
Additional battery charge information is shown if the mouse is hovered over the charge percent (or the charge percent is clicked). The remaining battery charge/discharge time is an estimate and is affected by the device’s recent power consumption.
Graphs

BER graph
Shows received Bit Error Ratio during a call.
Dejitter queue graph
Note
This graph is only shown if Advanced mode is enabled.
Shows the number of received packets waiting in the dejitter queue. All packets received from the network will go to this queue to eliminate network jitter.
If the dejitter queue length is too short, the graph’s line can touch zero during a call and the audio can stop for a moment as the device runs out of voice data to play.
If the queue’s length is too long, the delay can be uncomfortably high.
Setting the dejitter queue length
You can use this graph to set a proper dejitter queue length. There should be at least a few packets in the dejitter queue when receiving a call from the network.
You can set the dejitter queue length at the Network settings on the Network page (the setting only shows up if Advanced mode is enabled).
As a general rule, if you have a good network connection to the configured server, set dejitter queue length to 500ms, and if you have a mobile phone internet connection or voice stutters a lot, try setting the length to at least 1000ms.